

 As readers know, the recent paper Karl et al. 2015, written by the head of the National Climatic Data Center now NCEI, went to great lengths to try to erase “the pause” from the surface temperature record using a series of adjustments. Those adjustments are deemed unacceptable and criticized by some climate scientists, such as Dr. Richard Lindzen, Dr. Chip Knappenberger, and Dr. Pat Michaels, who recently wrote:
In addition, the authors’ treatment of buoy sea-surface temperature (SST) data was guaranteed to create a warming trend. The data were adjusted upward by 0.12°C to make them “homogeneous” with the longer-running temperature records taken from engine intake channels in marine vessels.
As has been acknowledged by numerous scientists, the engine intake data are clearly contaminated by heat conduction from the structure, and as such, never intended for scientific use. On the other hand, environmental monitoring is the specific purpose of the buoys. Adjusting good data upward to match bad data seems questionable, and the fact that the buoy network becomes increasingly dense in the last two decades means that this adjustment must put a warming trend in the data.
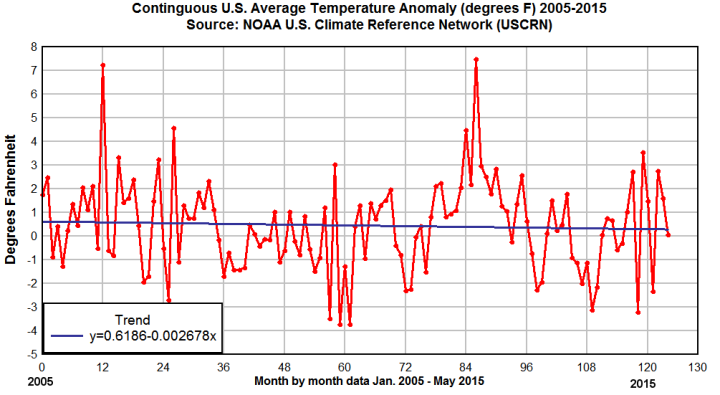
Clearly, a “pause” or “hiatus” exists in this most pristine climate data. In fact, a very slight cooling trend appears. But don’t take my word for it, you can replicate the plot above yourself using the links, free trial program, and USCRN data I provided from NOAA/NCDC/NCEI.
